The shaking began slowly and gently, as if a train were passing. As the seconds seemed to stretch longer and longer, however, the shaking became a rumbling with walls and windows swaying and rattling, followed by cracks creeping up walls, bricks cascading from above, and chimneys buckling. Then it ended, and a short-lived, eerie silence descended.
Few people who live around Puget Sound will ever forget where they were at 10:54 a.m. on Feb. 28, 2001, when the third major earthquake of the last 52 years rocked the region. Like the two previous quakes, the 2001 event occurred deep underground (30 miles) when the Juan de Fuca plate slid under the North America plate. The 6.8 magnitude earthquake released an energy wave equal to 4 billion pounds of TNT—nearly a million times more dynamite than it took to raze the Kingdome. Damages totaled more than a billion dollars, but fortunately no one died as a result of the tremor.
University of Washington geologists Derek Booth and Kathy Troost (pictured at top) were on campus when it hit. Both immediately knew what was happening and headed to the nearest doorway, but they did not stay long. As police closed bridges and viaducts, and as residents of Pioneer Square scrambled out of crumbled buildings, Derek and Kathy realized they were just beginning a great adventure.
The pair hopped into Troost’s dark blue, convertible Miata and sped down to Seattle’s SoDo area in search of damage. Specifically, the two wanted to locate areas of liquefaction, which occurs when an earthquake violently shakes sand and silt fill, forcing the sudden release of water within the sediment. This commonly causes structural failure during earthquakes, as the weakened soil turns into a tofu-like material and can no longer support great weight.
“The earthquake enhances and validates what we are working on. For that we are grateful.”
Kathy Troost, UW geologist
“It was exciting. We found sand boils erupting from cracks, basements covered with up to 18 inches of sand, 3-foot-deep cavities, and marks left by geysers that had shot silt slurries 6 feet up a wall,” says Troost. Probably very few people in the city could then utter her following words: “The earthquake enhances and validates what we are working on. For that we are grateful.”
Geologists are a funny lot. While many folks were trembling in fear during the Nisqually tremor, for Derek and Kathy the earthquake happened at a particularly opportune time.
Under the auspices of the United States Geological Survey (USGS), the University of Washington and the city of Seattle, Booth and Troost are producing a series of geologic maps that will paint an unprecedented picture of the geology of one of the most complicated cities in the country. The Seattle Mapping Project will be incorporated into the Federal Emergency Management Agency’s “Project Impact,” a program to help cities prepare their infrastructure and citizens for natural disasters. Seattle is one of only three localities, along with Memphis and Oakland, developing such detailed maps.
With this project, Booth and Troost will draw the geologic blueprint for the city, giving government officials, consultants and private citizens the plans for preparing to deal with earthquakes, landslides and other potential geologic hazards. The blueprint is desperately needed. The most recent geologic map of Seattle, known as the Waldron map, was produced in 1962, long before geologists understood plate tectonics or knew there was a fault line running through the heart of Seattle.
In contrast to most geologists, who prefer to explore exotic locales, Booth and Troost have spent most of their careers studying and exploring the rocky history of the Puget Sound region. Troost was a geology consultant for 19 years before returning to the UW in 1998 for her master’s and Ph.D. She was so obsessed with understanding this region that 20 years ago she started cramming her basement with material for a new Seattle geology map. “I got involved with this project because I love puzzles and I love helping people,” says Troost.
Booth, who received his Ph.D. from the UW in 1984, worked for a decade on geologic hazard permits and hydrology issues for King County before teaming with Troost, and is an expert on glacial deposits in Puget Sound. His reason for joining this project centers, in part, on poet William Blake’s great line, “To see a World in a Grain of Sand.” “With the right regional context, you can learn about the bigger picture and generate useful information that makes a difference to people,” adds Booth.
“One of the pleasant surprises of this project has been how interested the public is in the geology under their own houses.”
Kathy Troost, UW geologist
Geologic maps combine atlases and X-rays, showing the surface geology and topography, as well as the subsurface rocks and structures. They look like paint-by-number paintings with distinct blocks of color representing individual rock layers and lines indicating faults, folds and other geologic structures. Once completed in 2004, “unless we get more earthquakes,” quips Troost, the new Seattle geologic map will consist of four 1:12,000 scale maps, providing three times more detail than the 1962 Waldron map.
Making one of these maps in an urban environment is not a simple process. Even in the best geological situations, like the Grand Canyon, where one can see more than two billion years of Earth’s history, erosion constantly changes the story line. No matter where you look, more pages of the book are missing than are present. But in an urban landscape, geologists worry less about erosion and face a more efficient eraser of information: concrete.
Because of this, Booth and Troost have had to be patient, creative and persistent to find the smattering of spots in Seattle where they can put their hands and hammers on solid rock. During their explorations in West Seattle, they have bushwhacked through briars, waited several months for the year’s lowest tide to reveal rock, scrambled under bridges and overpasses, and ventured into many backyards in search of every outcrop, anomalous surface and landslide they could find.
“One of the pleasant surprises of this project has been how interested the public is in the geology under their own houses. Everyone has been friendly, sometimes almost too much so, slowing us down and telling us anecdotes about their rocks,” says Troost.
Urban geology also has its upsides. “At least some of the buildings contain coffee shops! A true advantage to working in the city,” says Troost. In addition to caffe lattes, Troost and Booth also have access to data and technology that most field mappers can only dream about. To build modern structures, contractors have to drill hundreds of 1- to 3-inch-wide bore holes, between 30 and 290 feet deep on construction sites.
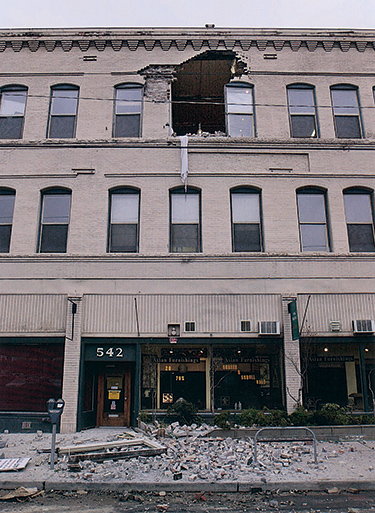
Damage to the facade of a Seattle building.
The drilling produces vertical shafts of rock—a cross section of the geology that lies beneath. Geologists then analyze the data, looking at groundwater conditions, density of the deposits and where different layers occur. For example, the first round of borings for Sound Transit’s light rail line found an ancient channel that ran east-west under the north end of Capitol Hill. Subsequent drilling found four parallel ancient channels that were naturally filled in by glacial and nonglacial deposits. The rising cost of the light rail tunnel under Capitol Hill and Portage Bay can be blamed, in part, on these deposits.
Usually this data just sits in a file drawer. “The people who obtain this information generally do not have the time or money to do a thorough and broad analysis. Kathy and Derek are able to go far beyond what most of us can do,” says Bill Laprade of the geotechnical consulting firm Shannon & Wilson. “By integrating the disparate data and analyzing it across the city, they make it far more valuable to the general public.”
These cores are helping Troost and Booth, in concert with other geologists, to clarify one of the most complicated and troublesome aspects of Seattle geology: which rocks make up the city’s famed hills, an important concern because not all rocks are made the same. For instance, some act as a sieve, allowing water to flow through them, while other rocks block the flow of water, which can oversaturate the layer above and weaken it.
A quick synopsis of our recent geologic past explains the complexity of our hills. Around 15,000 years ago, a 3,000- to 4,000-foot-thick ice sheet flowed out of Canada, moved as far south as Olympia, stalled there for about 500-1,000 years, and then began to retreat, leaving behind three distinct rock layers. The oldest and lowermost unit is known as Lawton Clay, 80 feet or so of dark gray, relatively impermeable clay and silt. Sediment settling into a quiet lake, which formed far in advance of the ice sheet, produced this layer, which can be seen in the lower cliffs of Discovery Park.
As the glacier crept south, streams carried material away from the ice snout and deposited a 120-foot-thick layer of poorly consolidated sand and silt, the Esperance Sand, on a flat plain in front of the ice sheet. During our notoriously wet winters, the highly permeable Esperance can become oversaturated because water cannot percolate into the underlying clay. This reduces soil strength and allows the sand to glide along the Lawton Clay. Most of Seattle’s landslides occur along the contact zone between the Lawton Clay and Esperance Sand. Discovery Park’s cliffs also hold examples of this layer.
A concrete-like bed of impermeable hardpan tops the pile. Known to geologists as Vashon-age Till, it often looks like poorly mixed concrete and consists of up to 30 feet of gravelly sand with scattered cobbles and boulders. Till is a direct product of the base of the glacier grinding the Puget Sound area into bits. Landslides also occur at the Esperance Sand/Vashon Till contact.
If geology were predictable, then a “typical” Emerald City knoll would look like a layer cake, with till atop sand atop clay, but the cores show that the subsurface geology is “predictable in its unpredictability,” says Booth. The Magnolia neighborhood’s landslide zone along Perkins Lane offers a fine example of this problem. “The Esperance is missing here, and one might expect this to be a more stable location because the till generally forms a coherent and enduring substrate,” says Troost.
“What is important about this data is that it helps us understand where damage occurs and how severe it can be.”
Derek Booth, UW geologist
“What we find, however, is that the till has numerous lenses of sand that effectively transmit ground water, creating zones of weakness in otherwise strong material. Second, the site lies at the edge of an older, larger landslide that involves not only the filled material at the foot of the slope but several lots to the northwest,” says Troost. “Thus a landslide hazard map predicated exclusively on the location of the sand-clay contact would not have identified this site as a zone of elevated hazard.”
While core samples have been a key to the mapping project’s success, the Nisqually quake was a boon, too. In the weeks following the tremor, Booth and Troost, along with researchers from the UW, USGS, and Western Washington University, combed the streets of Seattle and Bremerton looking for chimney damage. After surveying 50,000 to 60,000 chimneys, they catalogued more than 1,500 structures with damages ranging from simple cracks to total collapse.
“We were not surprised to see the damage, as we knew that widespread chimney failure occurred during the 1965 Seattle earthquake, but we were surprised by the pattern,” says Booth. Chimney failure occurs in a swath from Bremerton through West Seattle, South Park, and Beacon Hill, which corresponds nearly perfectly with the Seattle Fault zone, which lies directly under the city in those neighborhoods.
“The Seattle Fault did not move but may have acted as a lens, focusing seismic energy along a boundary between the two sides of the fault,” says Booth. On the south side sits harder bedrock, which has slowly pushed up about 5 miles over the last 10 million years, while softer sediments lay north of the fault. He speculates that the change in geology affected the seismic waves, possibly refracting them upward—like light being bent in a glass of water—or condensing the waves, making them larger and causing the shaking to intensify.
He cautions, however, that this model does not explain all of the data. “We do not know why so much chimney damage occurred in the Madrona and Green Lake areas,” says Booth. “What is important about this data is that it helps us understand where damage occurs and how severe it can be.”
In addition to ground data, the researchers will also map the land from above, using recently available technology called LIDAR (Light Detection and Ranging). LIDAR uses rapid pulses of laser light emitted from a low-flying (4,000 feet) airplane to precisely measure surface topography. Described by one researcher as “virtual deforestation,” because it maps the land as if no trees existed, the technology has led to the discovery of gullies and traces of faults on Bainbridge Island that no one had previously mapped.
Movement on the Seattle Fault would occur within 10 miles of the surface and has the potential to rupture the ground.
Booth and Troost’s first map, the West Seattle quadrant, will be available in hard copy and on-line later this year. In contrast to the black-and-white Waldron map, the modern one beautifully displays the surface geology in subtle shades of teal, chartreuse, lavender and charcoal.
Along with showing the lay of the rocks, the map provides a basis for understanding the geologic processes affecting people and landscape. At Mee Kwa Mooks Park, on the west side of West Seattle, for example, royal blue chevrons delineate the vertical faces of the uppermost cliffs. A line of red dots outlines zones susceptible to landslides, while green triangles mark where historic landslides took place. Red dots also wind into the hills above the park, showing how landslides have eaten away at what had been horizontal beds of glacial sediments.
On the shoreline is a pale green zone, which shows the beds that Troost and Booth waited several months for the right tide conditions to expose. Orange squares indicate where they found exposure of rocks at the surface. The Waldron map does not even recognize this unit.
And finally, those with access to the digital edition of the map will be able to click on one of many yellow circles to display bore cross sections, bringing to light the subsurface anomalies.
Booth and Troost are also focusing on practical information on the rocks. They are standardizing nomenclature so geologists will speak the same language; determining age and identification of geological units; and describing in detail these units’ properties, such as strength, thickness, source and liquefaction potential.
Of primary importance, particularly in light of the Nisqually quake, the maps will update recent discoveries and help planners better prepare for future earthquakes. The Waldron map does not indicate where the Seattle Fault lies, for the simple reason that no one knew the fault existed until the early 1990s. Geologists now have evidence that the northern edge of the fault zone basically runs along I-90 from Issaquah to Safeco Field, continues west through Alki Point, Restoration Point on Bainbridge, and Bremerton before terminating at Hood Canal. This 45-mile long, 2.5- to 4-mile-wide, east-west series of cracks has the greatest potential for significant earthquake damage in Seattle.
Unlike the Feb. 28 earthquake, which occurred 30 miles underground, movement on the Seattle Fault would occur within 10 miles of the surface and has the potential to rupture the ground. This happened most recently about 1,100 years ago, when the fault, in one dramatic movement, propelled rock up to 20 feet out of Puget Sound, triggering rock avalanches in the Olympics, underwater landslides in Lake Washington, and a tsunami that inundated West Point in Magnolia.
If a similar magnitude earthquake hit Seattle today, the city would be in shambles. We could expect damage similar to what happened in Kobe, Japan, in 1995. Port facilities, most of which are on fill, could be lost. Bridges and highways could collapse, and the shaking could trigger landslides larger than any produced merely by oversaturated soils. In addition, natural gas, sewer and liquid fuel pipelines, as well as major water supply lines, all of which suffered little or no damage in the 2001 earthquake, cross the Seattle Fault and could rupture if the ground moves 20 feet.
Their research, however, will not help predict earthquakes. “There is no scientifically reliable way of predicting the precise timing or intensity of an earthquake,” according to Ruth Ludwin, a research scientist in the UW’s Department of Earth and Space Sciences. For example, geologists know that the Seattle Fault last moved 1,100 years ago, and have some evidence possibly indicating two or three additional movements in the last 7,000 years, but that offers no more precision than sometime in the next several thousand years. For all anyone knows, the Seattle Fault could move tomorrow.
One of Troost and Booth’s principal Seattle Fault-related activities is locating traces of the fault, such as folded or displaced layers. As chance would have it, a traffic jam led to the discovery of one of these features. In December 1998, Brian Sherrod, a USGS geologist affiliated with the UW, was sitting in traffic when he noticed a set of folded and faulted beds under southbound I-5, just south of downtown. Unable to look then, Sherrod returned to the spot with Troost and Booth. They were amazed to discover a 200-foot-long section of rock that appeared to have been squeezed from either end by massive bulldozers. Although some debate exists, the three believe that movement in the Seattle Fault zone deformed the 70,000-year-old lake bed deposits.
“These exposures are important because they may provide datable geologic materials, potentially giving us recurrence and intensity information,” says Troost. “The more we look, the more we find. As additional sites of surface rupture appear, we will be able to provide planners with information to better predict how these materials will behave during earthquakes, how they transmit water, withstand loads, withstand steep slopes and affect natural resources.”
“Having applied science like this is essential. The data will help determine where to focus investigations, both before and after events, and allow us to maintain a high level of planning,” says Jim Mullen, director of Seattle’s Emergency Management Program. “The Seattle Geology Mapping Project is what we’ve been waiting for. It is what will guide us. It will help us save lives.”
How the quake was felt on Montlake
By Tom Griffin
We shook and we rattled, but the University of Washington held up pretty well during the 6.8 Nisqually earthquake that hit the Puget Sound region Feb. 28. The UW never closed, no one was injured, and most damage was cosmetic rather than structural.
The UW had to close several libraries temporarily due to falling books and ceiling tiles. Also, Schmitz Hall and the T-Wing of the Health Sciences Center were closed for several days while workers removed asbestos particles that became airborne when ceiling tiles fell along with asbestos pipe insulation.
Structural damage was limited to the Conibear Shellhouse, where bricks moved at the junction of two wings; Suzzallo Library, which suffered damage at concrete slab joints; and the Brooklyn Building, where a chimney fell. Inspectors checked the shellhouse, built on landfill, and declared it safe to occupy.
Even a month after the quake hit, estimates vary for the cost of repairs. The UW sent a request to the Federal Emergency Management Agency (FEMA) for $28 million, but that includes costs to mitigate impacts of future earthquakes. “I would say the actual damage is $10 million to $15 million,” says Jeraldine McCray, associate vice president for facilities services.
When the quake struck, workers had already torn apart the two older wings of Suzzallo Library for a $42.6 million seismic retrofit. While the project won’t be done until next summer, the work already completed made a big difference in how well the building fared. On its exterior, only four finial caps at the top of the historic building fell due to the quake.
While books in the 1962 Suzzallo wing fell from the stacks, books in the adjacent Allen Library stayed in place, thanks to quake-resistant stacks installed when it opened in 1990.
“The nine historic buildings that we retrofitted over the last decade showed no apparent damage, not even a crack,” adds McCray.
While the good news is that the UW held up remarkably well, the bad news is that FEMA will only cover 75 percent of the repair costs. The UW will have to cover from $2 million to $4 million in repairs, plus 25 percent of any mitigation work that FEMA funds. “We’re going to have to defer other projects we planned to tackle this year,” McCray says. “There’s going to be a lot of decision-making going on for the next three months.”