UW researchers lead the way in understanding the changing climate
UW professors track data that may reveal future droughts, bountiful harvests and even global warming.
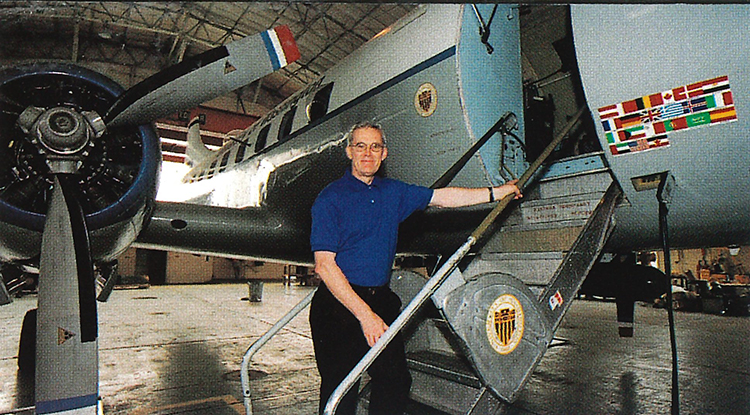
Atmospheric Sciences Professor Peter Hobbs stands next to the UW’s old Convair aircraft. A new Convair 580 will come soon to help the department’s climate prediction research. Photo by Mary Levin.
A 40-year-old gutted aircraft stands in a hangar at Paine Field north of Seattle, its temporary plywood floor and protruding wiring seeming to indicate the junkyard rather than a bright future in scientific research.
But the Convair 580 turboprop, obtained by the University of Washington from U.S. government surplus, is undergoing a $1.5 million retrofit that will soon make it one of the world’s finest atmospheric research aircraft. By early next year it will be an airborne “critical-care” unit, analyzing the atmosphere in many different ways, from temperature and humidity to structures of clouds and pollution. The mission of Peter Hobbs, the aircraft’s guiding spirit: to understand how nature seems to be protecting the Earth from greenhouse gases, the fallout from humanity’s industrial appetites.
Yet there is more than just global warming on his mind. Hobbs, a UW atmospheric sciences professor, hopes to find data in the skies that will pin down better predictions of what the climate will be in the future.
Hobbs is part of the new world of climate prediction, a world made possible by supercomputers and weather observations made on land, on the sea, in the sky and in space.
Since the early 1990s this emerging science has undergone such rapid growth that today 10 institutions worldwide are making relatively reliable climate predictions. Their monthly forecasts, made for one year ahead, are winning a host of disciples: coffee growers in Brazil concerned about the futures market, farmers in Australia who may have to switch to drought-resistant seeds, salmon fishers in the Northwest who track salmon runs, water managers who worry about reservoir levels, and state and federal disaster agency officials.
Few institutions have had as profound an impact on this science as the UW. Whether researching short-term predictions based on Pacific Ocean water temperatures or providing data for the century-long challenge of understanding global warming, UW scientists are in the forefront. We are, says Atmospheric Sciences Professor Edward Sarachik, in the early stages of discovering “where the memory of climate lies.”
One of 70 research buoys stretched across the Pacific. Photo courtesy of M. Neimer, NOAA.
What is climate? Well, it isn’t weather. Weather is something that happens in days, or at the most two weeks, and then is gone. Weather is tomorrow’s high winds, next weekend’s rain or next month’s sunshine. Climate is summer and winter, it is months or even years during which global movements of hot and cold ocean waters and air masses go through cycles that can bring droughts or floods.
If weather forecasting is cause and effect on the shortest possible time scale, then climate prediction indicates the global conditions in the oceans and the atmosphere for years ahead. As researchers like to put it, “Climate is what you expect. Weather is what you get.”
Climate prediction research at the UW is fast moving on three fronts:
- Short-term forecasting of one to four years ahead. These predictions are based on the episodic appearance of warm surface waters in the Pacific Ocean, called El Niño, which can cause climatic chain reactions around the world.
- Medium-term predictions involving changes in climate that can persist for decades. The big problem to be solved, says UW Atmospheric Sciences Professor Mike Wallace, is “to learn how to recognize these transitions when they’re occurring, without the benefit of hindsight.”
- Long-term prediction, looking ahead 50 to 100 years. This relies on a deeper understanding of global warming. Since the beginning of the century, there has been a 1 degree Fahrenheit rise in the average temperature of the Earth’s surface. One difficulty facing scientists is sorting out how much of the temperature rise has been due to industrial pollution, and how much is due to natural climate variations.
Of these three intensive programs, short-term predictions based on El Niño has become the star performer, with increasingly accurate predictions now widely available. Even the U.S. government is now issuing a thick monthly manual of predictions for the coming year.
“I get invited to talk to the Oil Heat Institute every year and they want the latest El Niño forecast because they need to know how much oil to stock up,” says Atmospheric Sciences Professor Clifford Mass. Every industry affected by climate, from clothing manufacture to water management, wants the predictions, he says. As Sarachik points out, “Predictions help stabilize markets.”
El Niño has been known since the last century when Peruvian fishermen noticed that in many years, usually around Christmas, unusually warm coastal waters brought a sudden, months-long change in the climate. They called the phenomenon “the Christ child,” or El Niño in Spanish.
Gradually the term came to refer to the episodic appearance of warm surface waters into the normally cold waters of the central and equatorial Pacific. In time, another phenomenon involving a global redistribution of barometric pressure, the Southern Oscillation, was shown to fluctuate in step with the comings and goings of El Niño. Acknowledging that the ocean and atmosphere are linked by the mutual transfer of heat, moisture and motion, scientists now call the entire climatic phenomenon ENSO (an acronym for El Niño and Southern Oscillation).
And although ENSO occurs in a narrow equatorial belt about 500 miles wide, its global effect is powerful, with a typically warm (El Niño ) climate lasting from a few seasons to several years. The most devastating conspiracy of ocean and atmosphere this century occurred between 1982 and 1983, bringing drought to Indonesia, Africa and Australia and severe flooding in South America, disasters that cost thousands of lives and resulted in $13 billion in damage worldwide. In the U.S. there were storms and mud slides in California, flooding in the Gulf states, and a sharp reduction in the salmon catch in the Pacific Northwest. Since then there has been ENSO warming in 1986-1988 and in 1992. Wallace notes that a sudden increase in ocean temperatures this summer signals the onset of what looks to be a very strong return of El Niño this year.
The 1982 El Niño caught scientists by surprise. But since then the U.S. government has supported a continuing international effort to study the phenomenon. One of the most visible signs is a string of 70 research buoys stretching across the Pacific, each tethered by a nylon line over a mile long, measuring everything from ocean temperatures and currents to surface winds.
The buoys are part of an observing system sending a daily stream of data via satellite to the prediction centers around the globe. The buoys were developed and are maintained by National Oceanic and Atmospheric Administration scientists in Seattle, and among the users of the data is a federally supported research center at the UW, headed by Sarachik.
Stroking his black Labrador Margaret, a constant presence in his office, he says, “We now understand that El Niño alters the mean climate of the Earth. Without El Niño it would be a different Earth, a little cooler in the East Pacific with a different distribution of temperature between the north and the south.”
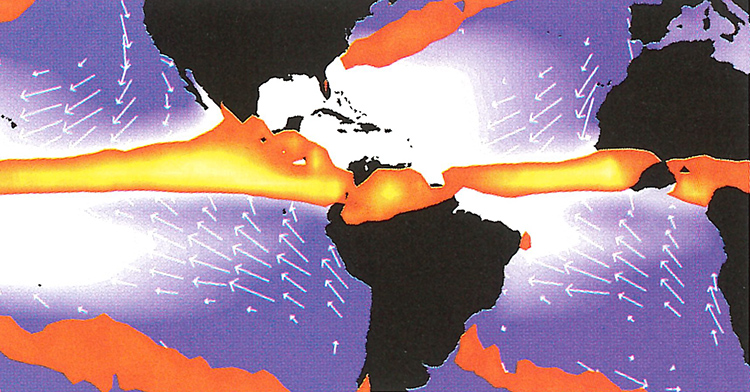
Climatological July conditions over the Pan American region. Blue shading indicates the distribution of coldest sea surface temperatures; the arrows show the position of the strong surface winos in relation to the cold sea surface temperatures; and the orange-to-yellow shading indicates precipitation.
But he also speaks of the continuing complexities of understanding El Niño. Nine years ago, UW Professor David Battisti first advanced the currently accepted theory that ENSO arises through a coupling of an unstable ocean and atmosphere, and that the events recur an average of every four years. “Why four years?” Sarachik asks. “There is nothing intrinsic in the climate system that says it should be four. We might expect a year, because the sun moves back and forth over that period.”
There are other complications. Years in which tropical sea surface temperatures are below normal—the flip-side of El Niño—tend to have colder winters brought by what has been dubbed La Niña (the young woman). Professor Mass has studied the effect of La Niña years on snowfall at SeaTac Airport, and has found that the winters averaged 16.9 inches of snow. During El Niño winters the average was only five inches. It isn’t that there is more precipitation during La Niña years, he says, it’s just that the freezing level is much lower in the atmosphere, resulting in more snow.
Last winter was such a La Niña period, resulting in the Christmas week winter storms that slammed into the Northwest. Seattle’s bus operator, Metro, was especially hard hit, says Sarachik. “There were no chains for the buses because it hadn’t snowed for five years. If Metro had asked me I would have told them, buy chains this year. I couldn’t have told them exactly when it was going to snow, but I could have said the probability had shifted toward snow. We had that information.”
The sudden year-to-year differences between ENSO and La Niña can also spell troubles for water managers. Because the El Niño period produces warm storms, snow freezes only on the higher elevations, meaning a smaller snowpack and less spring runoff. In 1992 Seattle had an acute summer drought, with restrictions on water use. It was the result, says Mass, of water managers ignoring advice from El Niño experts to close their dams early and allow the water to rise in the reservoirs. Instead, the water levels were kept low, and the spring runoff couldn’t fill the reservoirs.
Today, short-term predictions based on El Niño are becoming routine, but forecasting of decades-long changes in climate are still in its infancy. The reason, says Wallace, is that it is a puzzle made up of many diverse parts. They have names that trip the tongue so easily they could be flowering plants or grunge rock groups: the Pacific Decadal Oscillation, the North Atlantic Oscillation, and the Tropical Atlantic Dipole. All involve patterns of atmospheric pressure and winds that reverse direction every few decades. These reversals seem to be the markers for decades-long recurrences, whether bountiful or brutish, such as harsh winters in Europe, droughts in sub-Saharan Africa, or strong cyclones in the Gulf of Alaska.
Between 1925 and 1945, for example, the winters in the Pacific Northwest were mild and the winds over the Gulf of Alaska were strong, conditions that UW Fisheries Professor Robert Francis believes were responsible for the abundant catches of Alaska salmon during those years. The following 30 years had exactly the opposite conditions. But starting around the late 1970s, winters turned milder again, winds over the Gulf strengthened and the Alaska salmon harvests improved dramatically, even surpassing those back in the ’20s through the ’40s.
Can we look forward to more mild winters and inexpensive Copper River sockeye salmon? The difficulty for scientists is recognizing such long shifts while they are happening and not five to 10 years after they have occurred. “It’s hard to distinguish them from shorter-term changes such as those caused by El Niño,” notes Wallace, a lean, genial man who is the UW’s newest member of the National Academy of Sciences.
One key to developing accurate predictions is the ocean, which is the flywheel, or memory, of climate. The ocean has a very long memory, partly because it is so sluggish—ocean currents are typically slower than the winds by a factor of 100—and partly because of its enormous heat storage. A layer of ocean water 10 feet deep has more heat capacity than the entire area of the atmosphere above it.
Computer simulations of the climate offer the hope of making sense out of this vast array of data so that we will ultimately be able to recognize and perhaps even forecast these decades-long shifts, says Wallace. As an example of the different ideas that might one day provide a basis for such predictions he cites teleconnections, the theory that abnormal climatic conditions in far-flung regions of the globe are linked via the jetstream.
While these measurements are in decades, predictions of global warming involve centuries. There is wide speculation that greenhouse gases, including about half of the nearly seven billion tons of carbon dioxide that human activity produces each year, are drifting into the atmosphere and acting like a radiation blanket over the Earth’s surface.
In 1995 a United Nations panel placed the blame on the industrial gases. A global treaty that would set targets on greenhouse emissions could be signed following December’s “Earth Summit” in Kyoto, Japan. However, such targets could prove costly to the industrialized nations. And there is wide disagreement about whether the human-made emissions have actually contributed to the small rise in global temperatures, or whether the temperature increase is due to natural climate cycles.
There is a problem with most computer simulations of global warming based on human-made emissions. The results say that the amount of heat-trapping gases should cause a much sharper increase in warming than scientists have recorded. To account for this conundrum, scientists look to the “sulfate paradigm” theory. They suggest that burning fossil fuels creates a haze of sulfates in the atmosphere. This haze acts like a grimy shield, reflecting sunlight back into space, offsetting some warming from the greenhouse effect.
But Hobbs has now complicated their assumptions. In May he and Dean Hegg, research professor of atmospheric sciences at the UW, reported on their airborne analysis of the chemical content and reflective properties of the haze. To their surprise they found the sulfates were outnumbered by carbon particles—from burning forests and fossil fuels as well as natural sources. Since carbon particles absorb more light than do sulfates, they have less tendency to cool the Earth.
So if this haze is not the cooling factor that lessens the greenhouse effect, what is? Hobbs speculates that the answer lies with microscopic particles from industrial emissions. These particles act as seeds for the formation of water droplets in clouds. And clouds, being reflectors of sunlight, cool the global surface.
Hobbs thinks that once it is understood how human-made emissions are affecting the atmosphere, the extent of global warming can be calculated more accurately. Then it becomes a political problem. “We will be able to provide governments with various scenarios for them to consider. If we continue to burn fossil fuels by `X’ amount, then this will be the consequence. But if we decrease our use of fossil fuels by `Y’ amount, then this will be the benefit.”
That will be a struggle for this and future generations. Other prediction problems also lie ahead, such as a 23,000-year climate cycle linked to the procession of the equinoxes, and a 41,000-year cycle connected with changes in the tilt of the Earth’s axis of rotation.
But these are for future millenniums to worry about.